Odoo BI gives you everything you need to get started with business reporting: dashboards, pivot views, and ready-made financials. It’s a strong foundation for growing teams, and when the time comes, it can be extended to handle more complex needs.
Odoo offers built-in BI reporting
Odoo comes with a capable set of tools for Business Intelligence: dashboards, pivot tables, financial reports, and even an Excel-style interface that works across apps. It’s great for ad-hoc analysis and daily business decisions.
1. Financial reports
Odoo comes with standard accounting reports like:
- Balance Sheets
- Profit & Loss
- Cash Flow Statement.
These reports support filters (journals, timeframes, etc.), comparison periods, and export options (PDF, Excel).
They’re quick to generate and good for regular bookkeeping or monthly overviews.
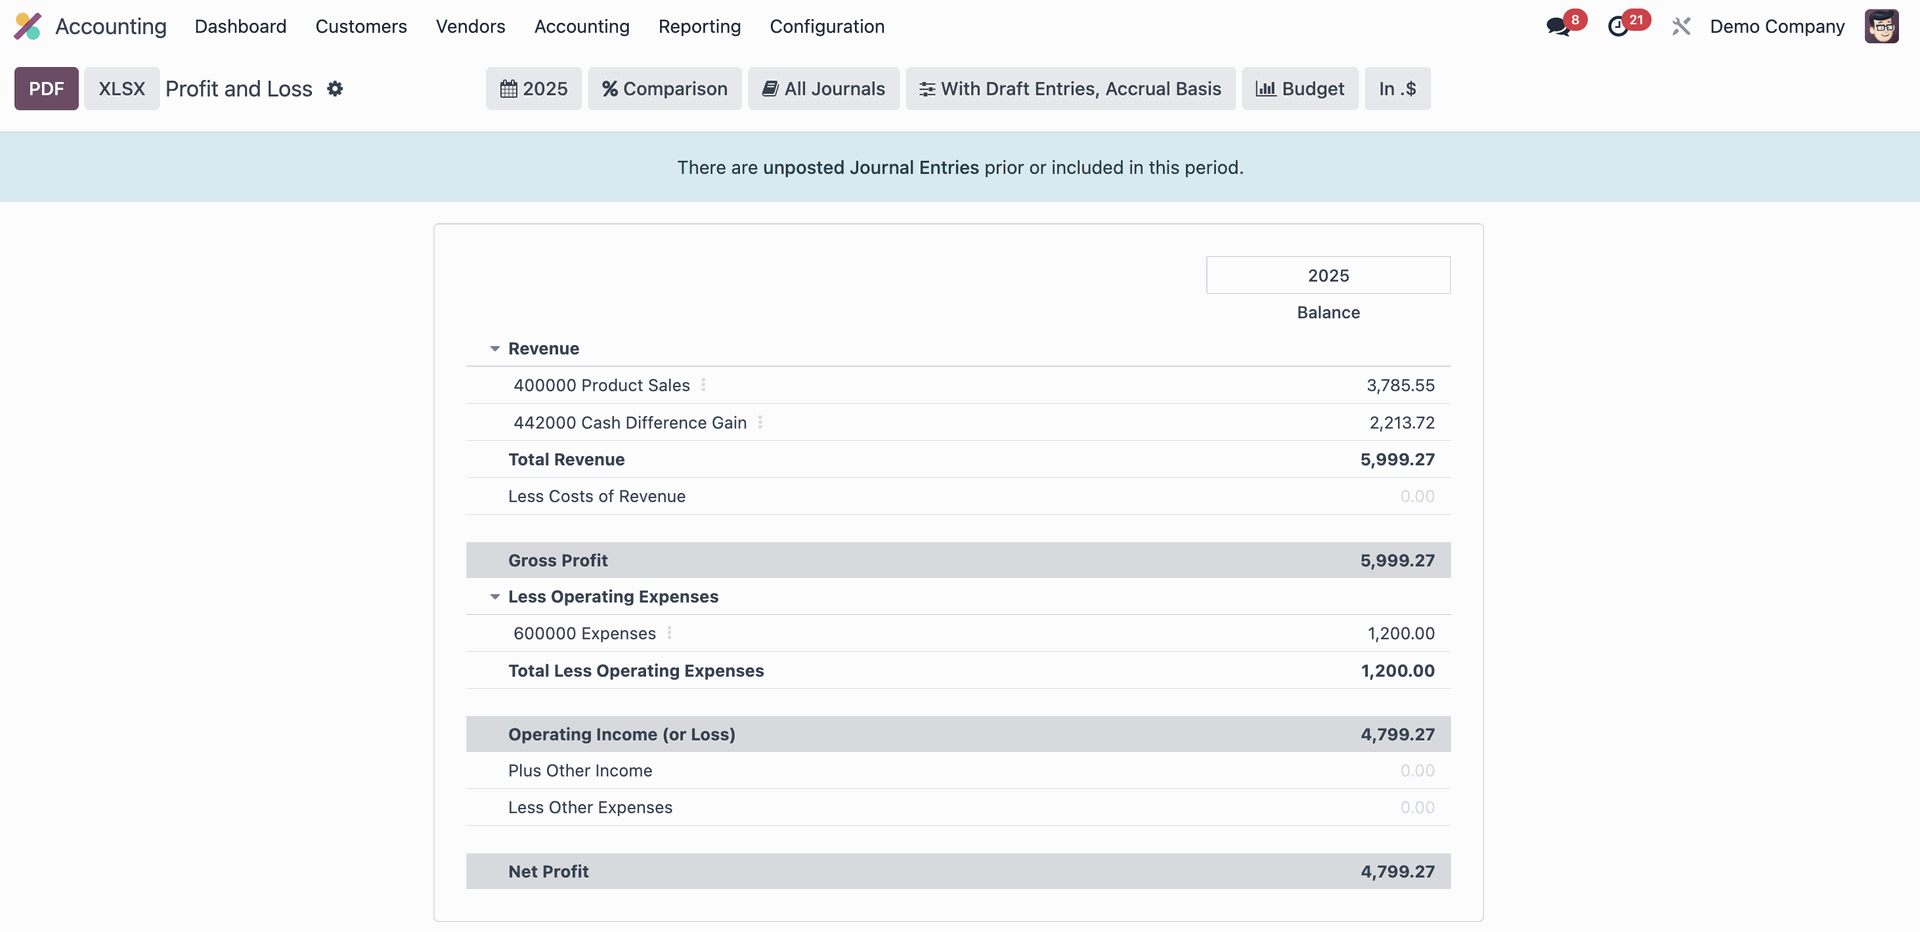
Odoo P&L report in Accounting
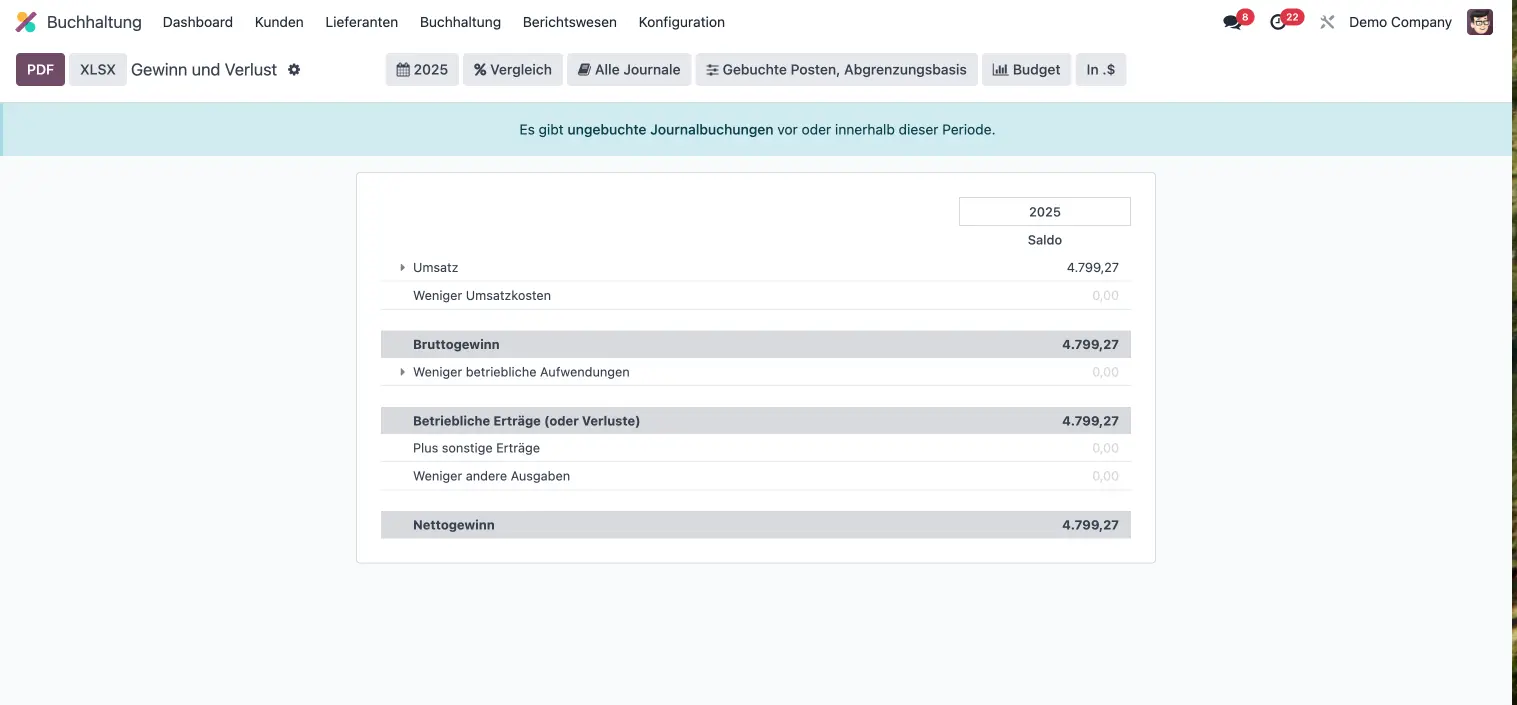
Odoo P&L report in Accounting
2. Dashboards & Excel-style views
For sales and other operational data, Odoo includes:
- Prebuilt dashboards with KPIs (e.g. number of orders, revenue, average order value)
- Trend charts (e.g. monthly sales)
- Breakdown tables by top products, countries, or salespeople
- A spreadsheet-like interface for financial ratios (profitability, liquidity, solvency, etc.).
This works well for management monitoring and day-to-day business tracking.
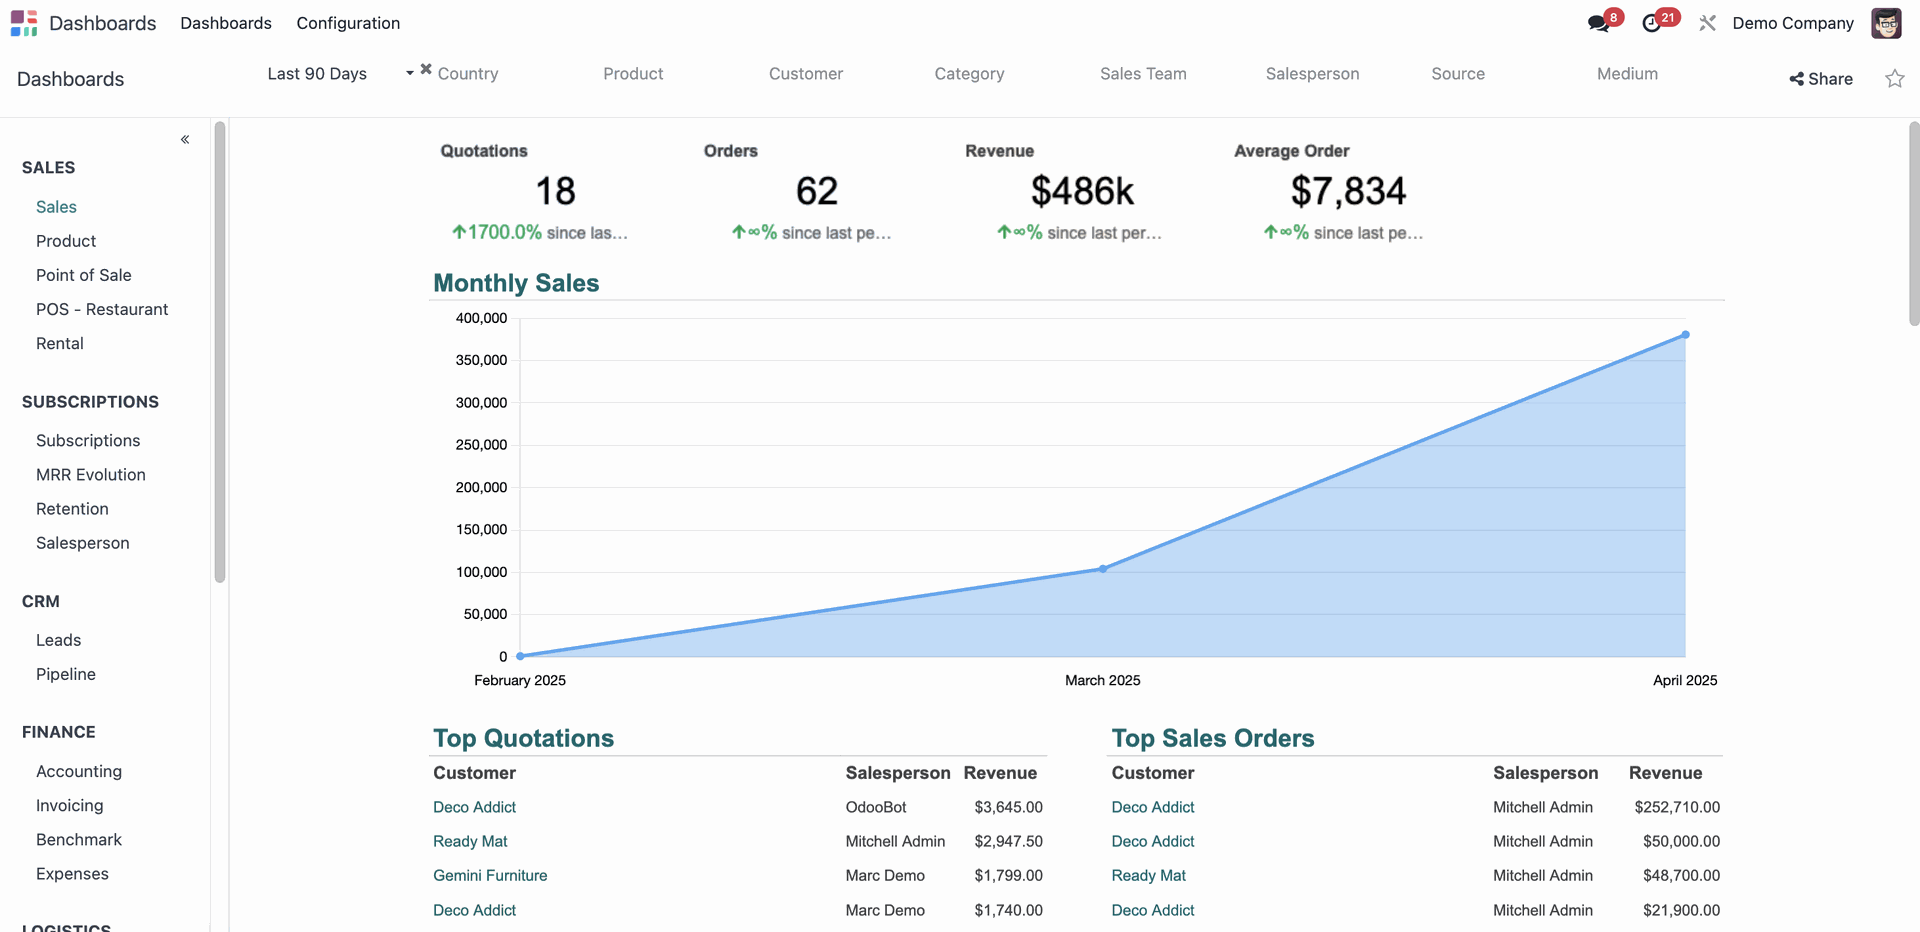
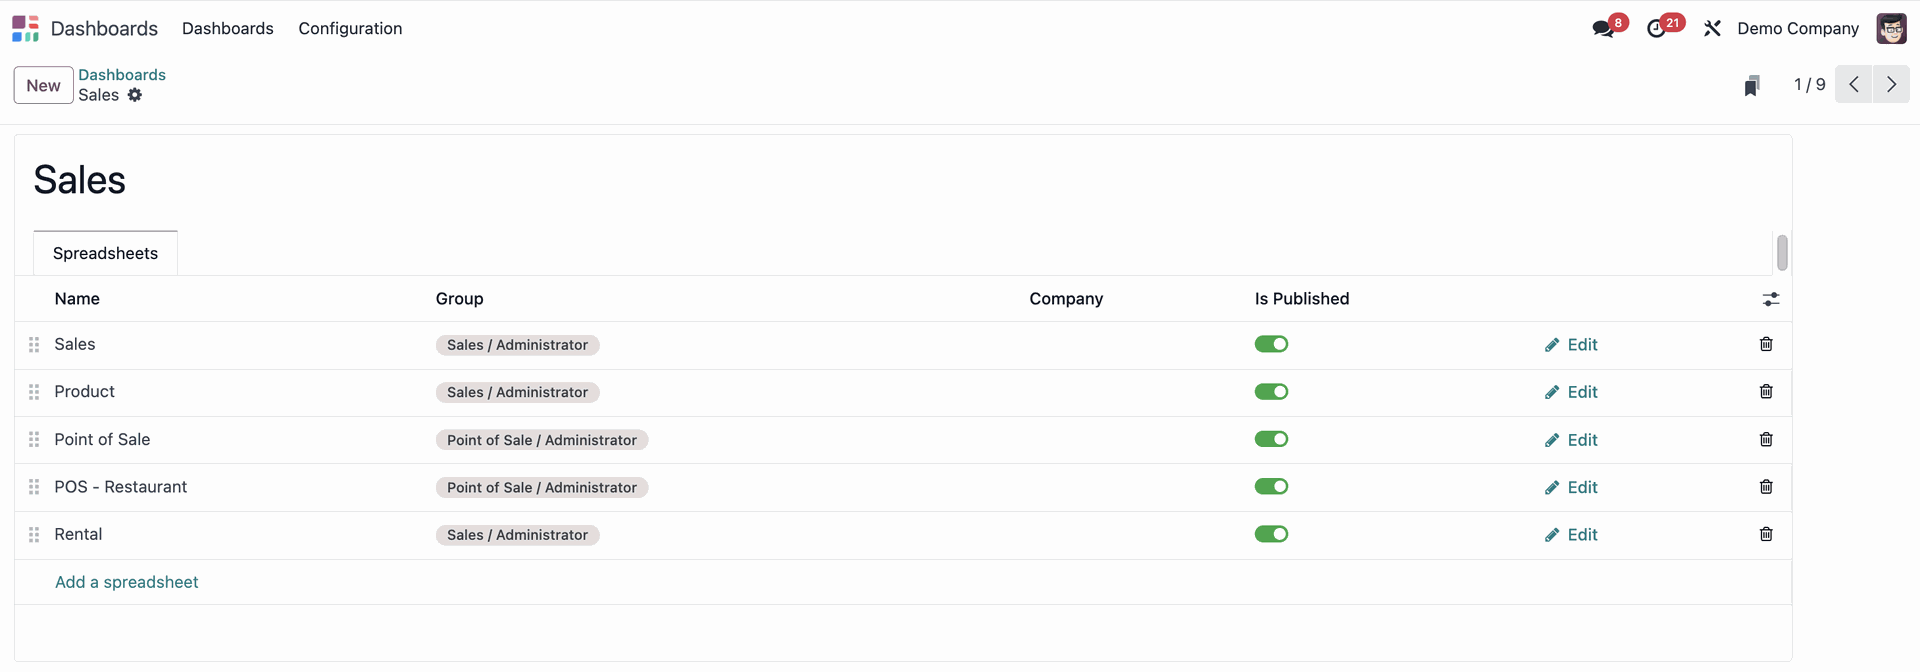
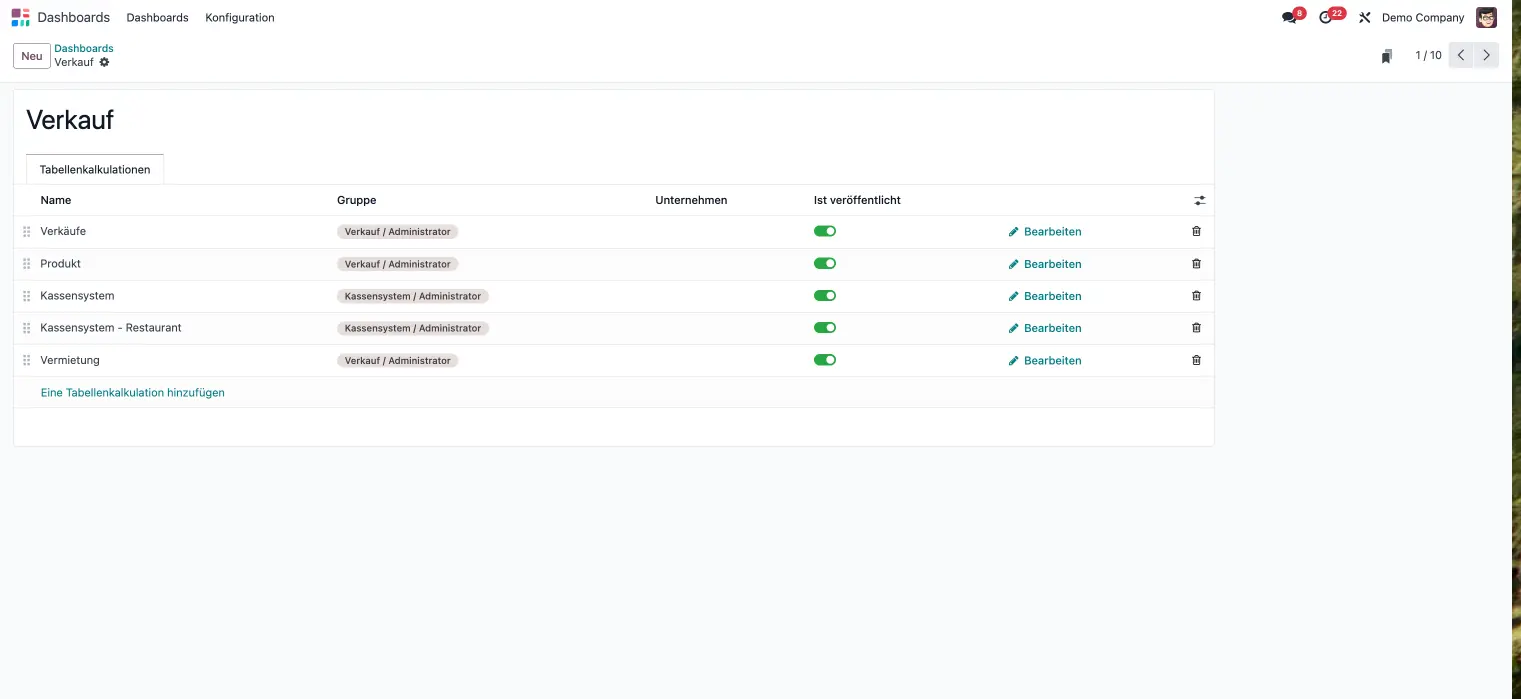
Odoo BI Dashboard app for Sales.
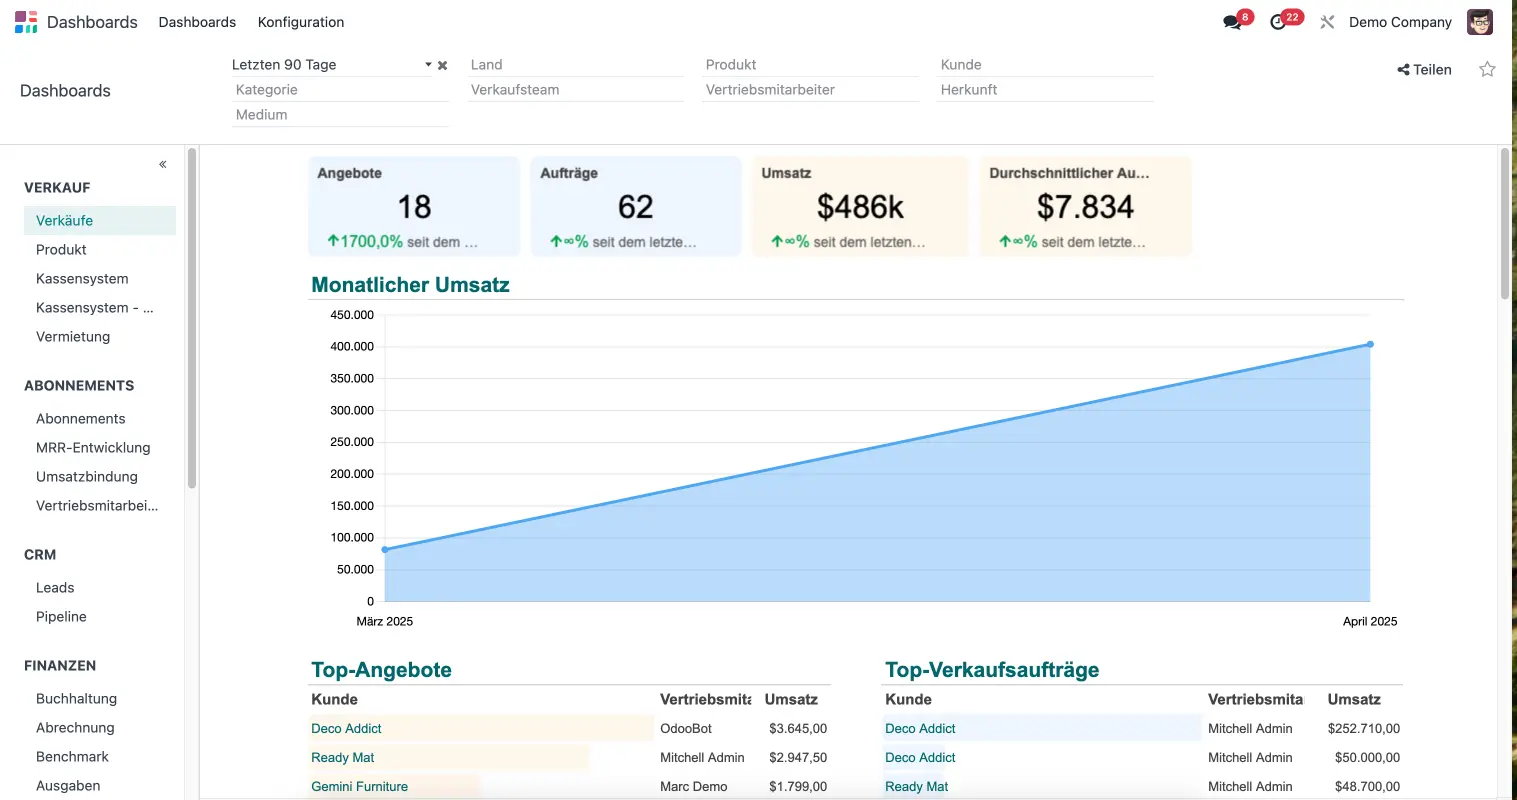
Odoo BI Dashboard app for Sales.
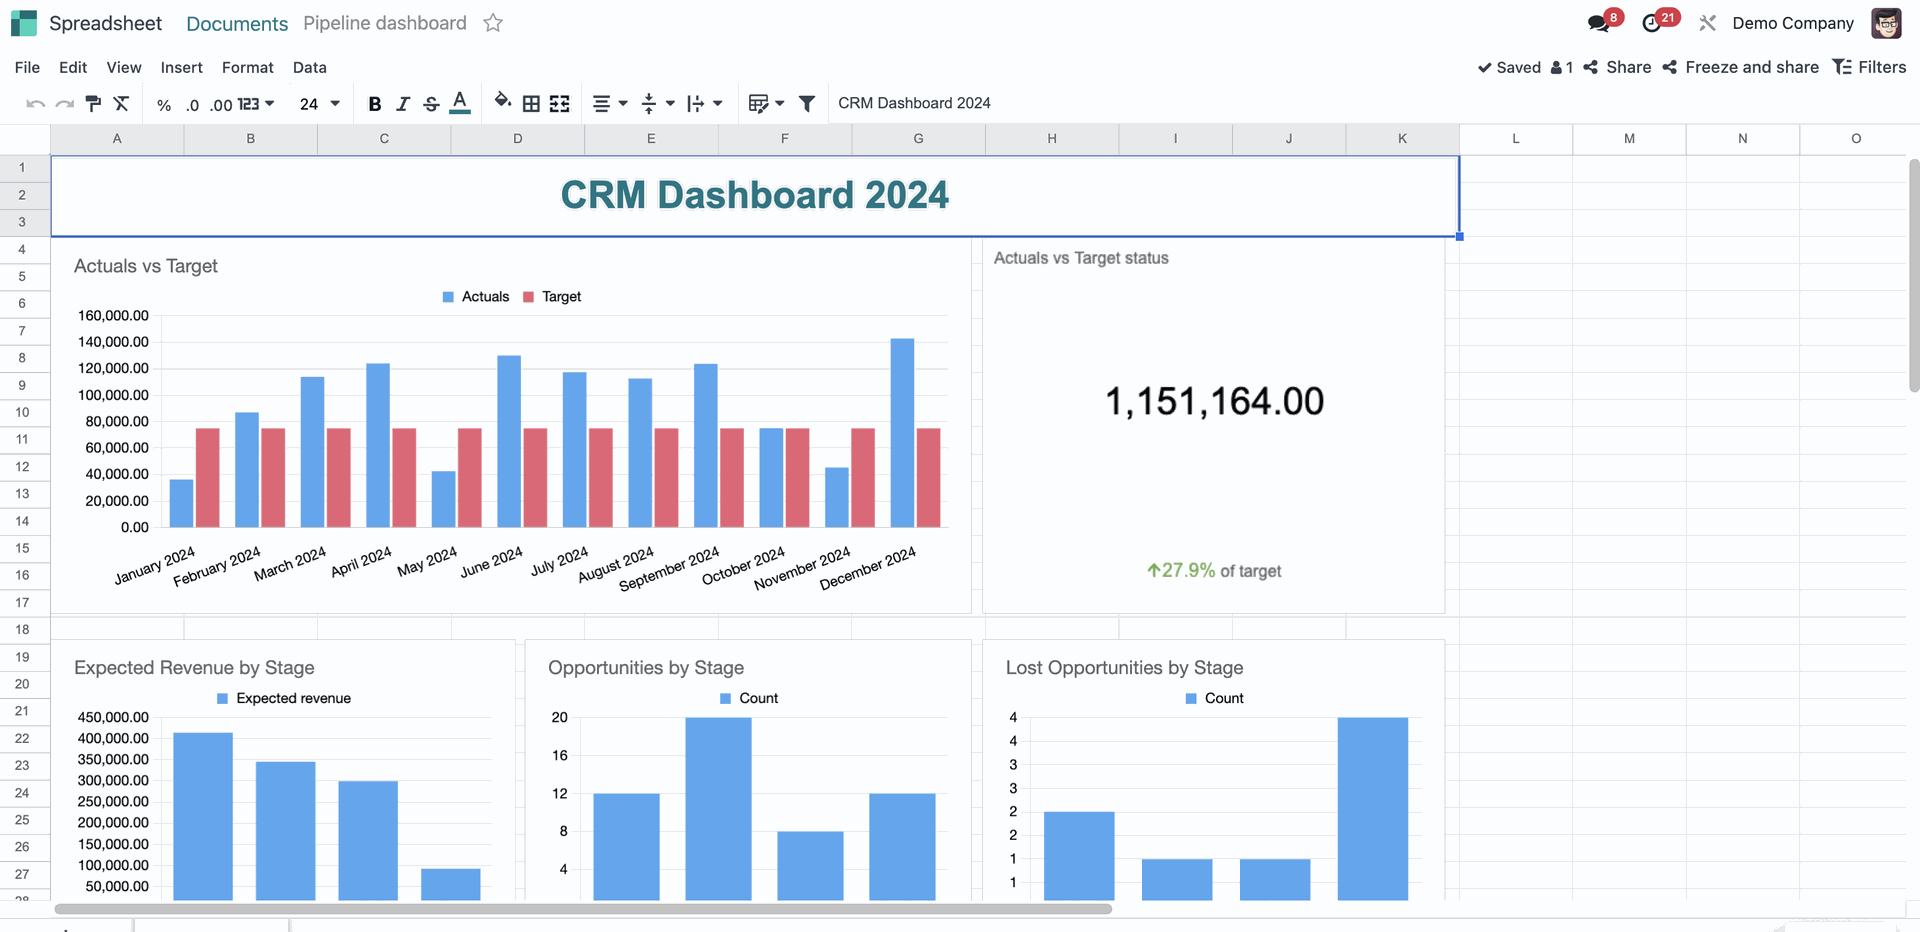
Odoo Excel-like Spreadsheet app, with a template for a CRM dashboard.
3. Pivot views & Geo visualisation
Odoo’s real-time pivot views let users slice and dice data however they want:
- Group by pipeline stage, salesperson, region, or time
- Export or insert the pivot into dashboards or spreadsheets
- Expand/collapse levels (like subtotals in Excel).
There’s also a map view for location-based data, helpful for territory planning and sales distribution.
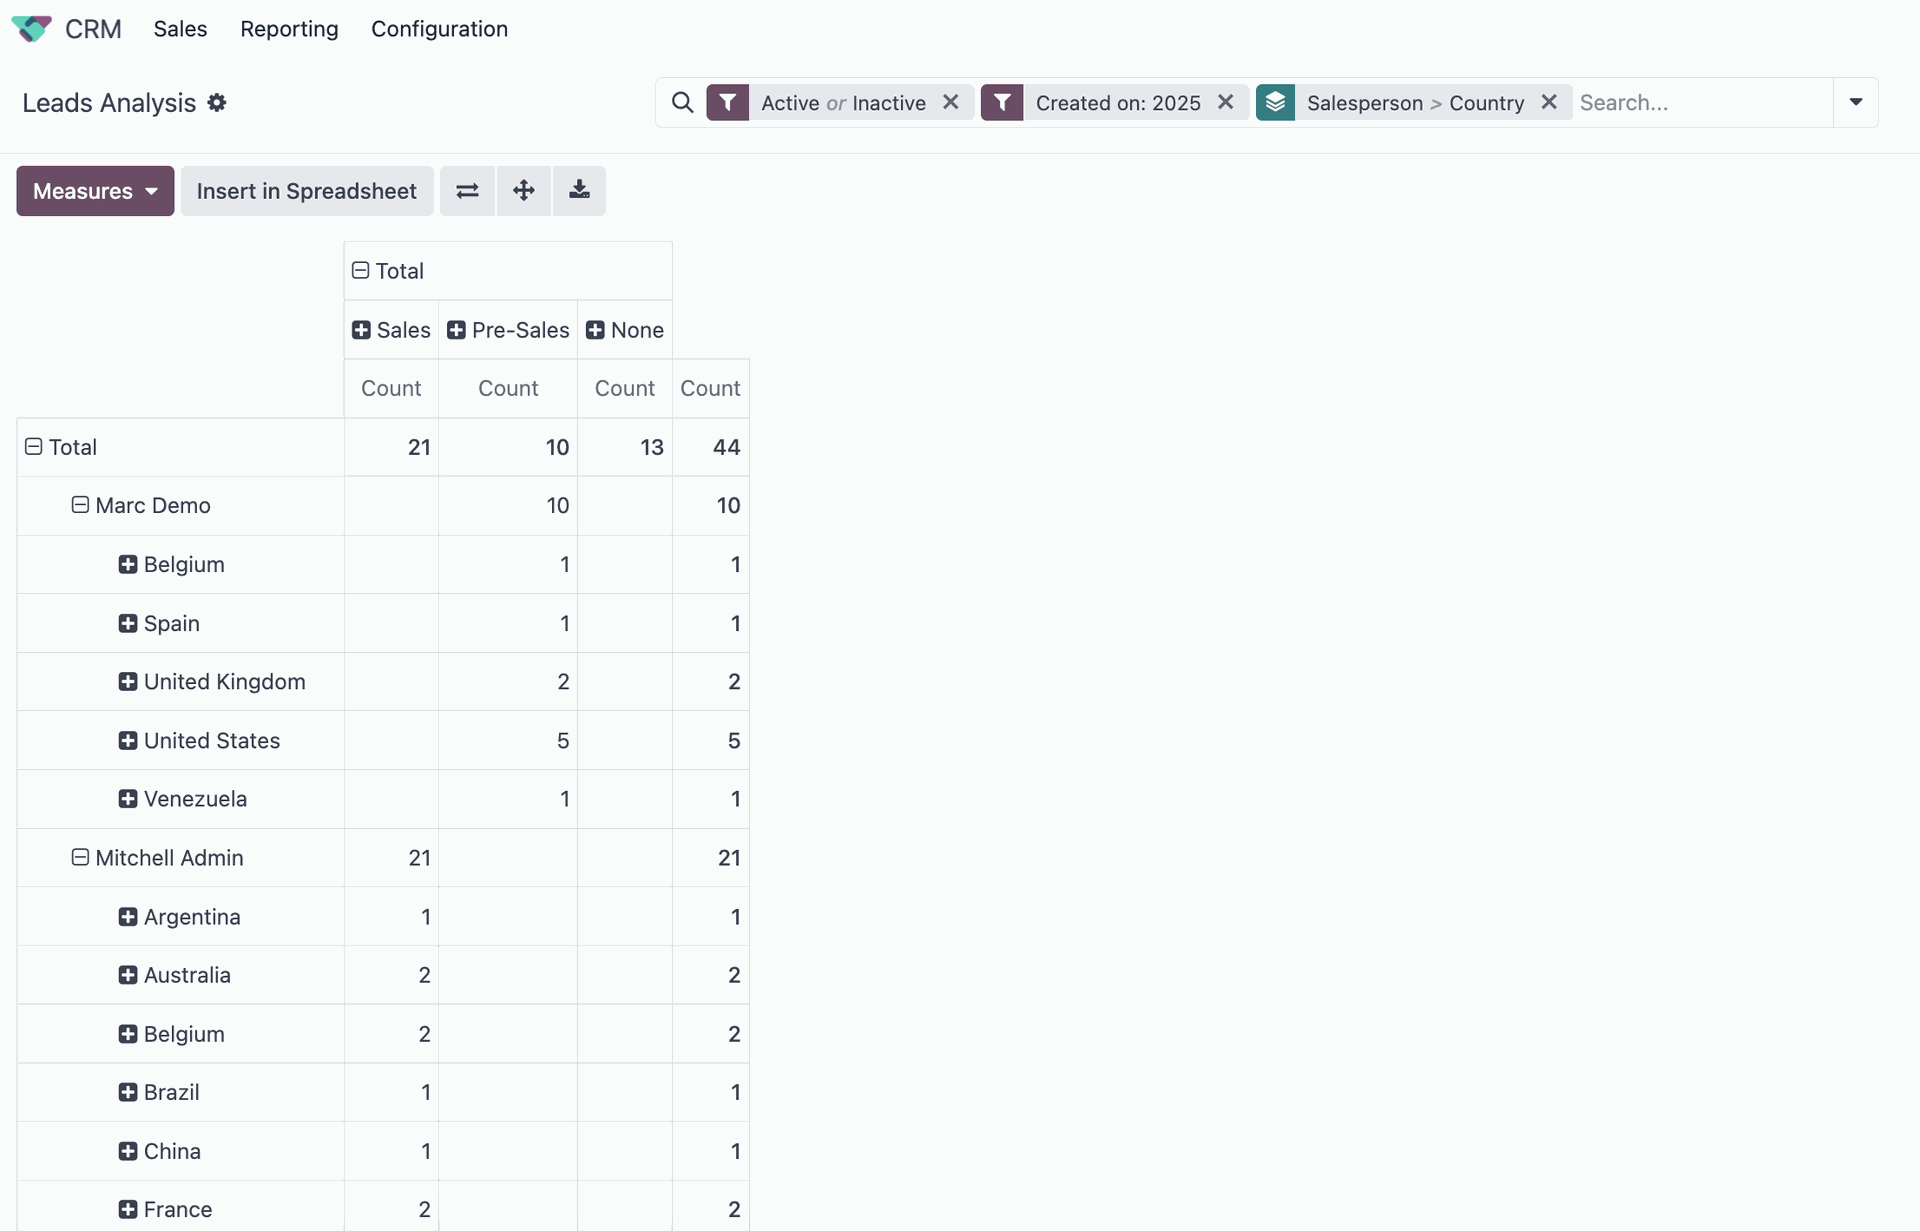
Odoo Pivot Table in CRM.
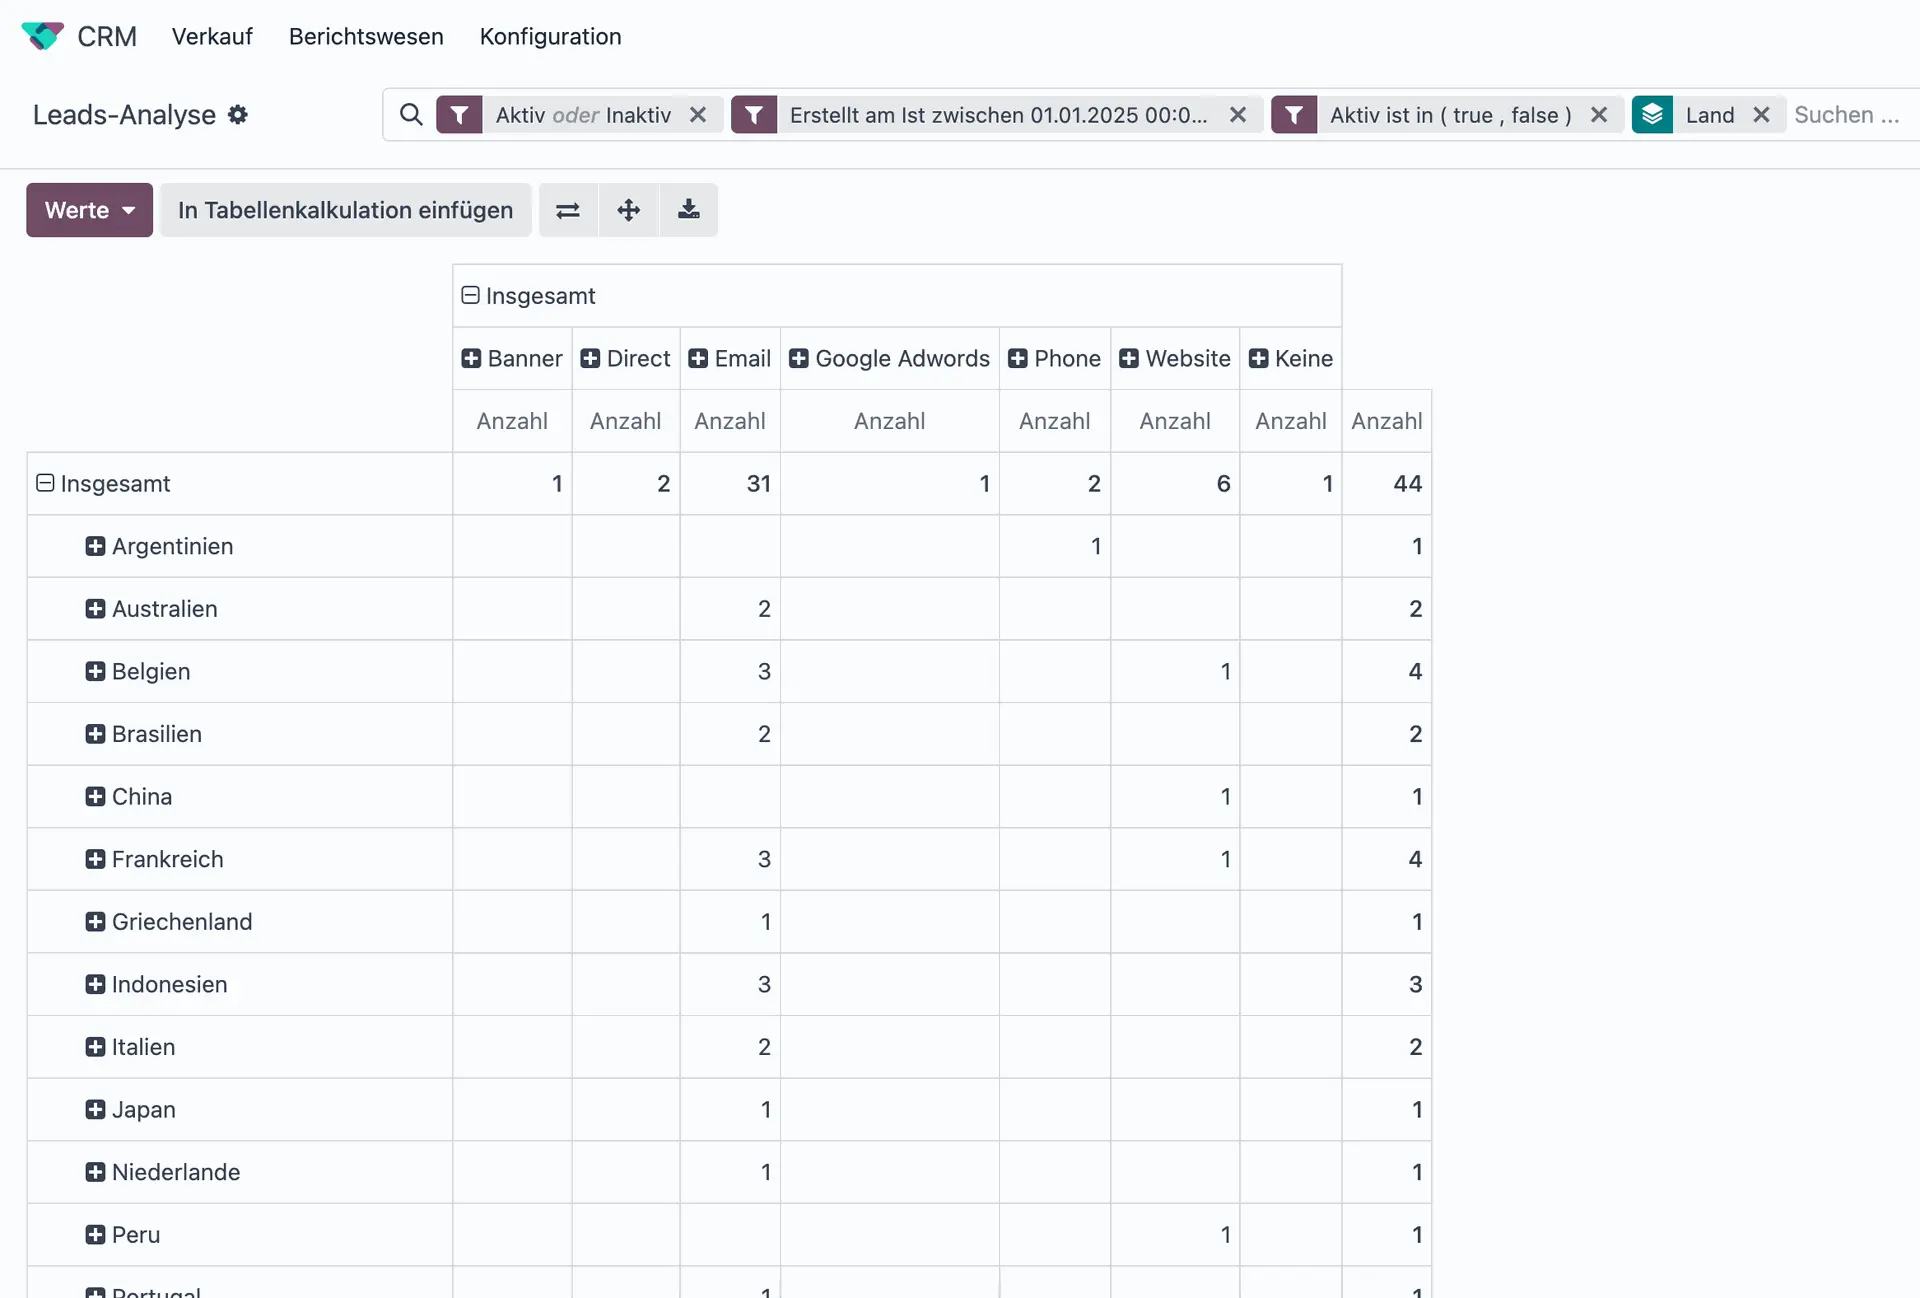
Odoo Pivot Table in CRM.
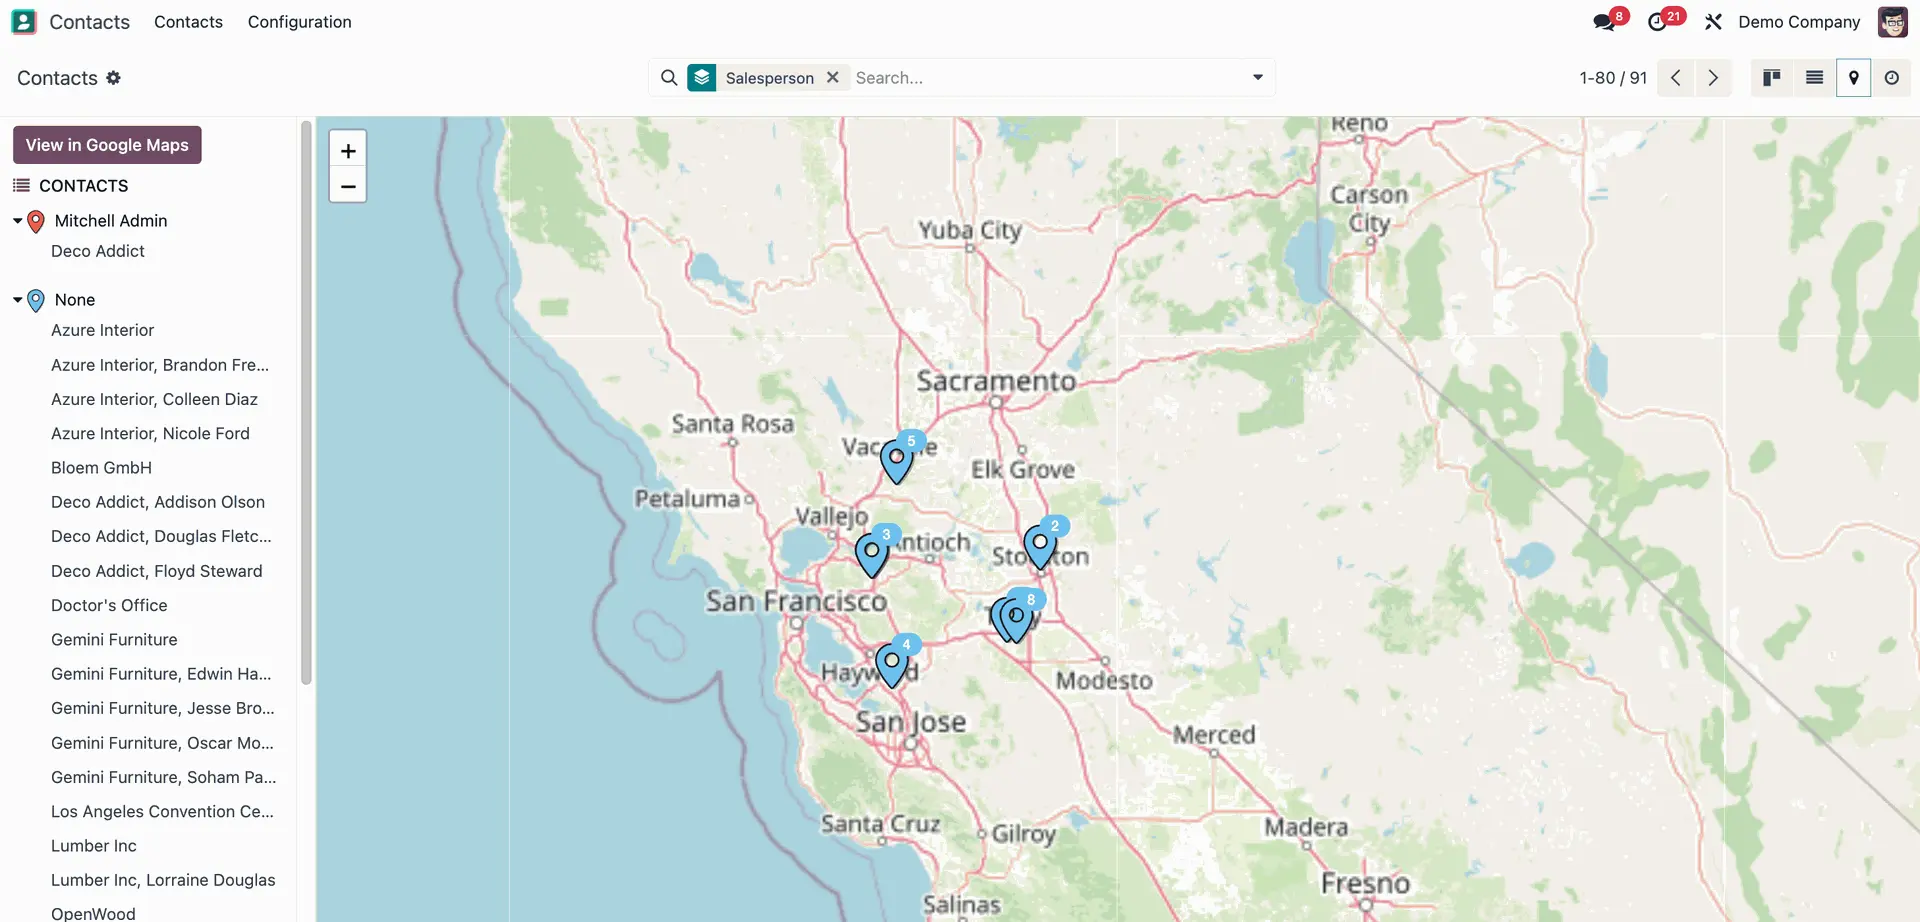
Odoo Map View for Contacts filtered by allocated Salesperson.
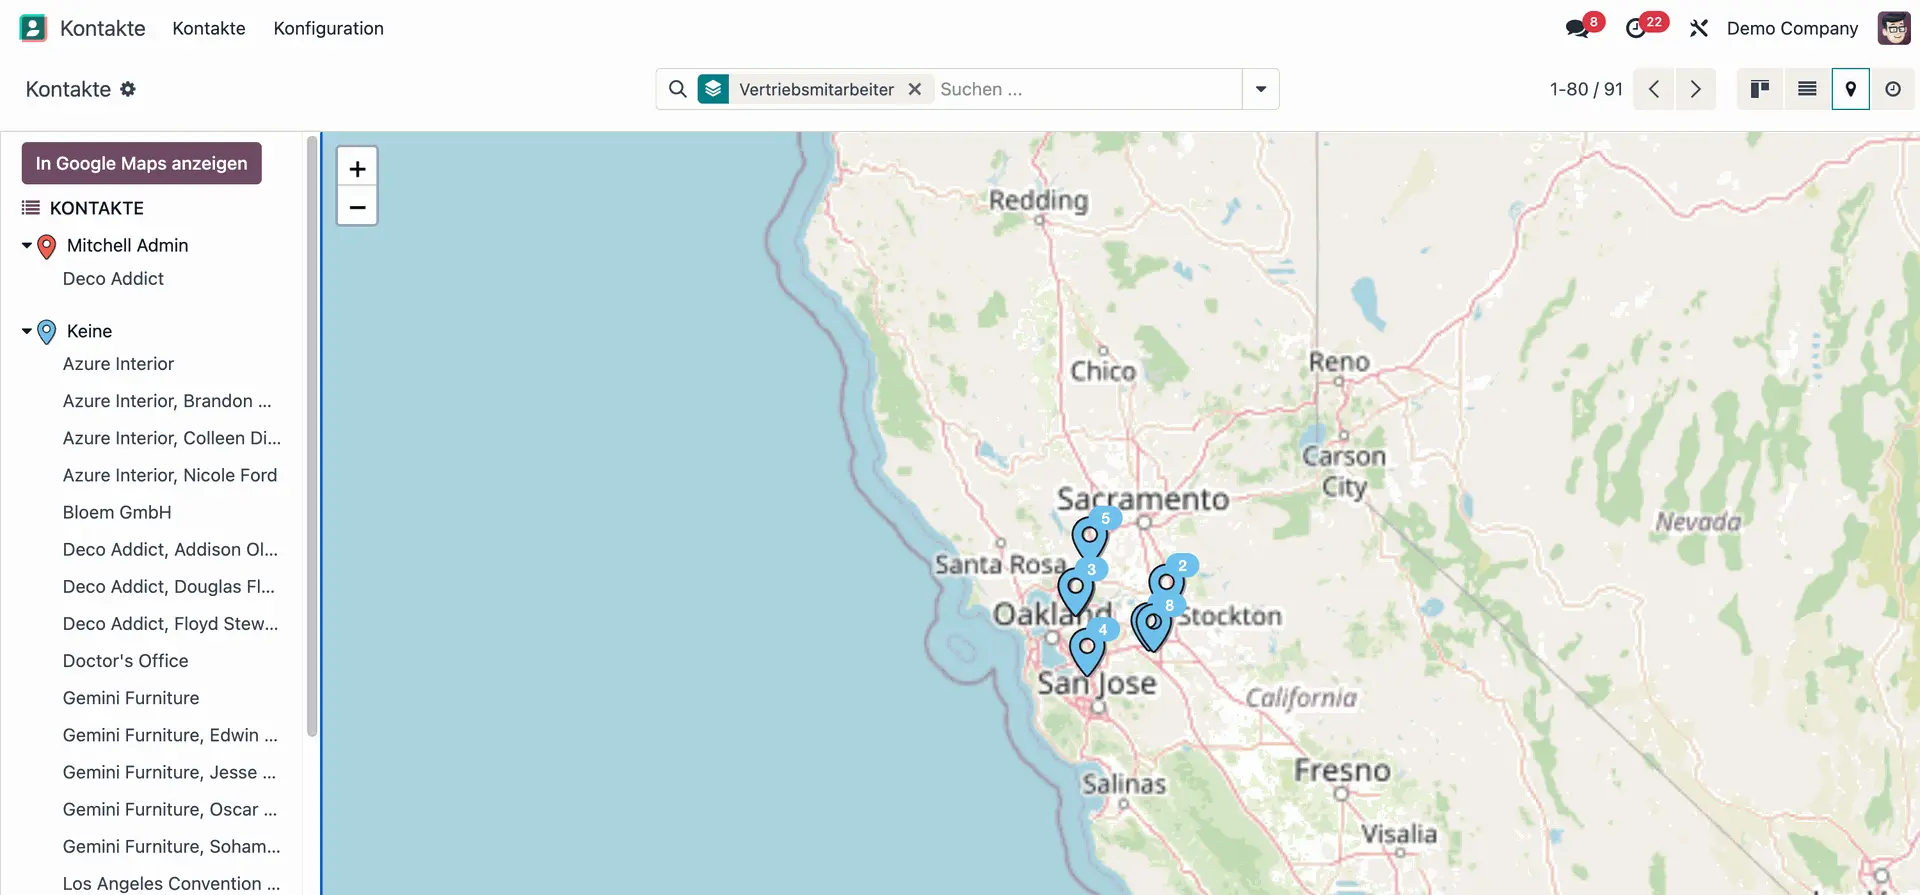
Odoo Map View for Contacts filtered by allocated Salesperson.
4. Other views: Calendar, Dashboards, Reports
- Calendar view to visualise deadlines or activities by due date
- Report builder with filters and export options
- Dashboards with live KPIs and configurable charts
- Shareable links to dashboards for internal access.
Odoo BI feature - Dashboard configuration.
Odoo BI feature - Dashboard configuration.
Still, Odoo’s built-in BI has limits
While these reports are great for general insights, they’re still limited to:
- One app at a time: Cross-app analysis is still limited as a standard feature (e.g. revenue vs. project hours)
- No external data: You can’t bring in data from other tools like Shopify, Google Ads, or a legacy system
- Limited visuals: There’s no drag-and-drop chart builder or custom visualisations like funnels or maps (beyond the basic ones)
- Manual setup: Building more complex dashboards often requires developer support or technical workarounds.
External BI tools can be integrated to expand Odoo
For more advanced reporting needs, you can integrate Odoo with external BI tools like Power BI, Tableau, or custom-built dashboards.
With the right integration, you can:
- Combine data from Odoo and external sources
- Create custom dashboards and advanced visualisations
- Build forecasts and data models
- Automate reporting flows across teams or roles.
Odoo’s built-in BI is strong enough to cover most daily needs.
You can run quick checks, explore your data in pivot views, and monitor your business in real-time without leaving the system.
But if you want deeper insights, it might be time to consider integrating your Odoo with a more advanced BI solution.
Scale your BI with Odoo and data warehousing & integration
As data volume grows, Odoo’s built-in reporting eventually reaches its limit.
Large reports take longer to run, and database speed begins to drop.
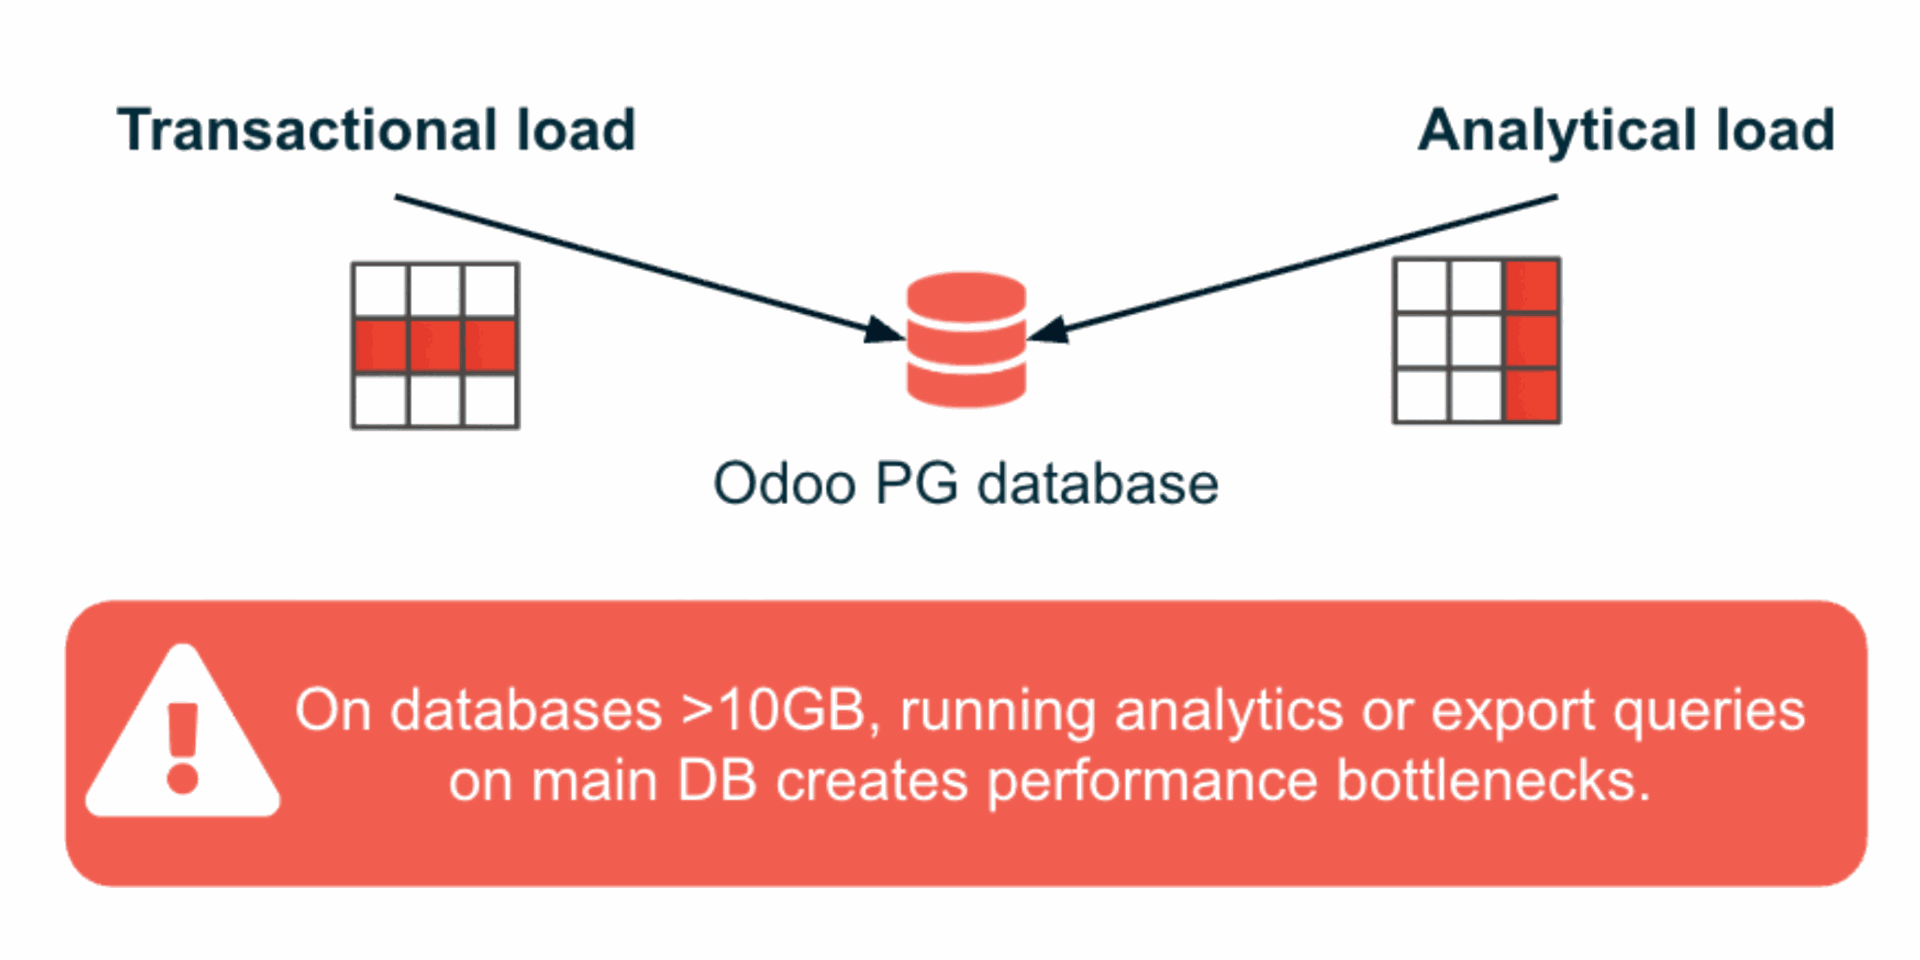
Odoo databases over 10GB can face performance bottlenecks when running analytics.
To keep Odoo fast, we have helped companies move their heavy analytical work outside the system into a dedicated data warehouse.
A data warehouse acts as a separate environment designed for analytics. It receives a live copy of your Odoo data in real-time, so dashboards and queries can stay accurate and run without overloading your Odoo and slowing down your daily operations.
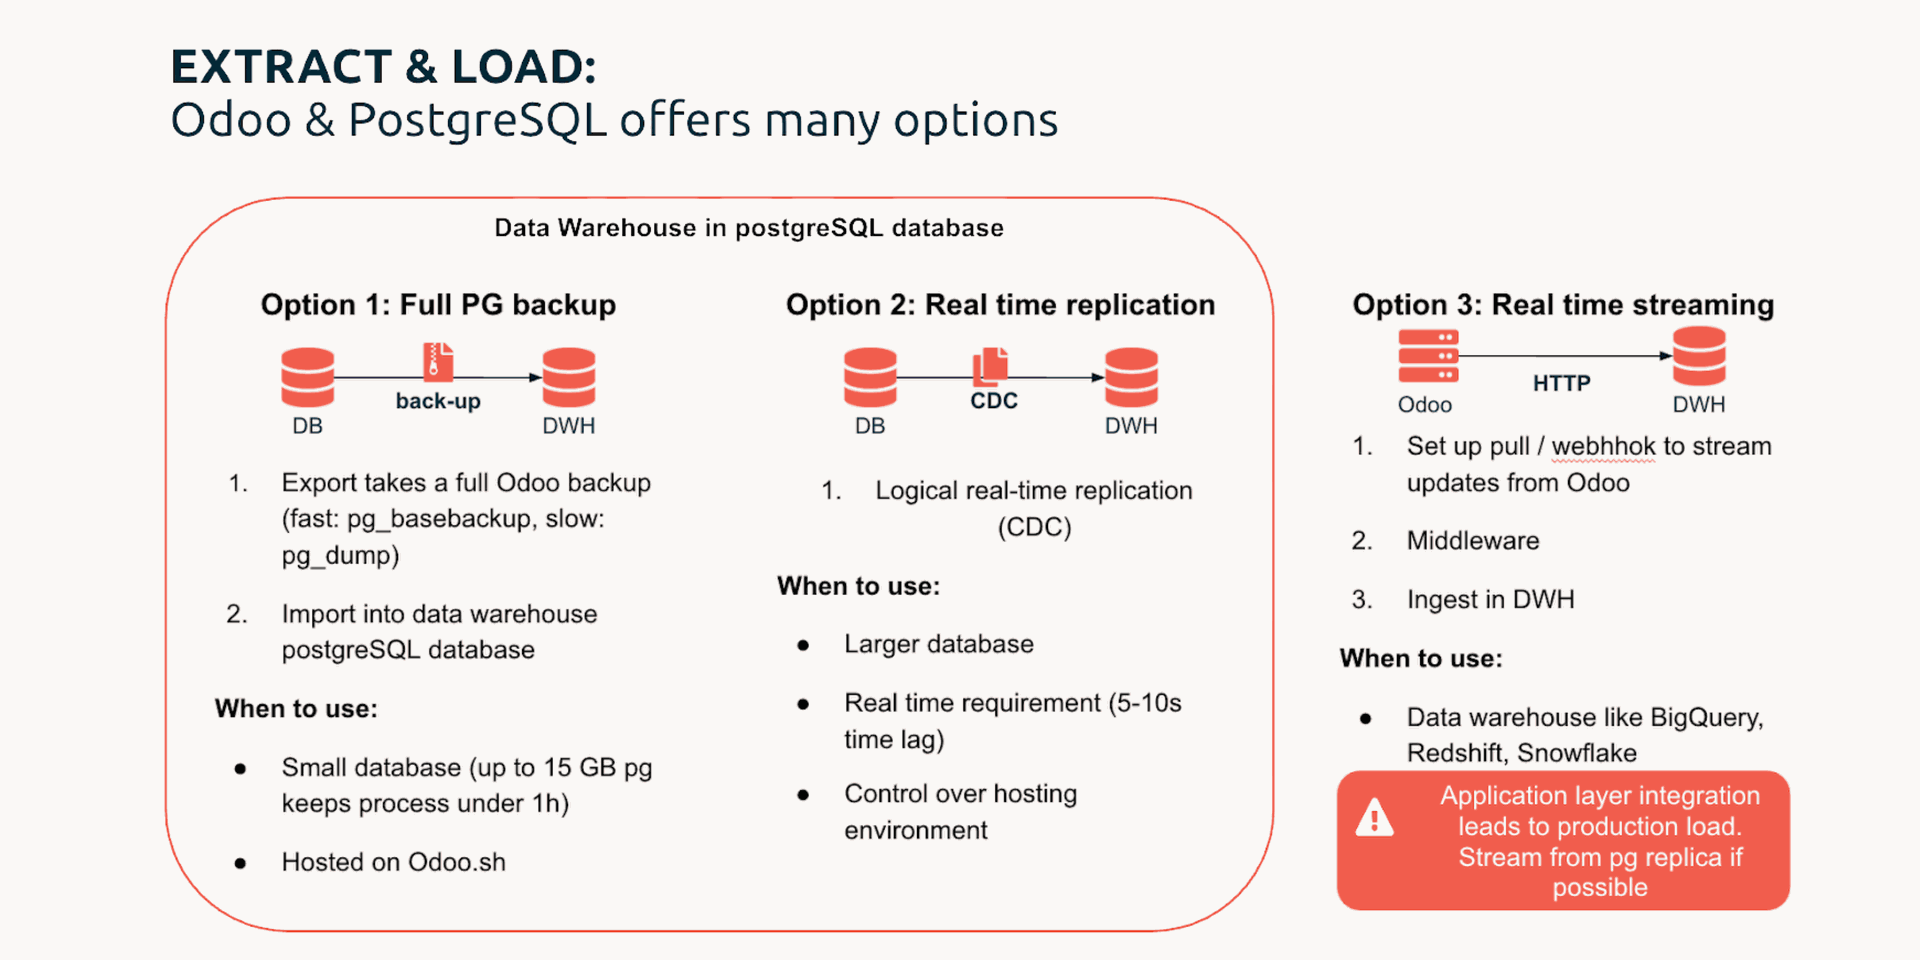
The Extract & Load method with Odoo & PostgreSQL works for many live-time database copying use cases.
Inside the warehouse, the data is reshaped into clean, readable models that replace Odoo’s complex raw tables. Reports process faster, and the information remains consistent even as the database grows.
From there, tools like Power BI, Tableau, or Superset connect directly to the warehouse.
They combine Odoo data with information from other integrated systems to create a single source of truth for deeper analysis.
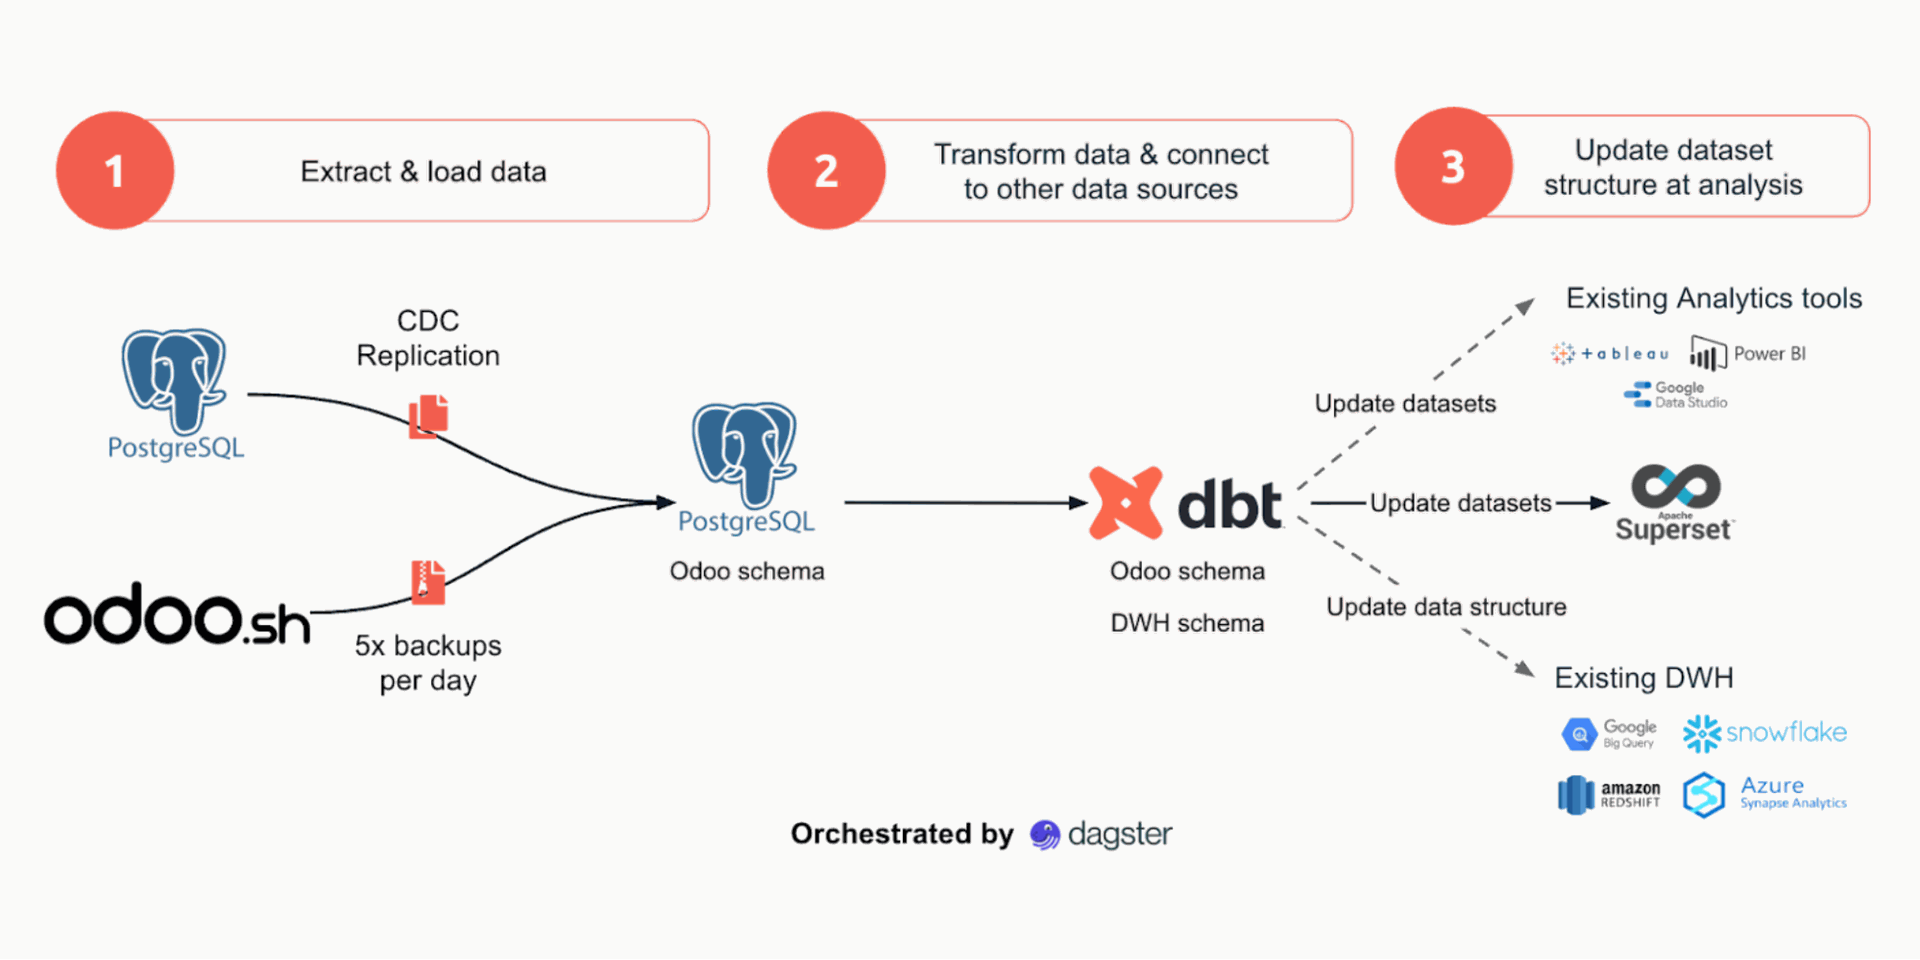
Our Odoo BI solution uses dbt and Dagster to replicate Odoo data and prepare it for analysis in the BI tool of your choice.
This way, Odoo continues to handle daily business, while the data warehouse powers the advanced insights behind it, with live Odoo data.
This setup keeps BI fast and ready for future growth.
Key benefits of Odoo BI with data warehousing
Simplified analytics structure: A flattened data model makes Odoo data easier to read and speeds up analysis for BI teams
Connected data sources: Integrated data from multiple systems creates a complete view across all business areas
Advanced analytics: Specialised tools enable stronger predictive insights, machine learning, and advanced AI beyond Odoo’s built-in dashboards
Secure governance: Independent access rights and data anonymisation ensure security and compliance.
At the Odoo Experience 2025, our Managing Partner, Simon Stappen, broke down the technical and practical aspects of expanding Odoo BI. Check it out:
Integrate Odoo BI with advanced data analysis solutions
Discuss how to make the most of Odoo BI capabilities with our experts. We can help you find the right setup for your Odoo and BI needs.